Binomial Distribution
The binomial distribution models the number of successes in a fixed number of independent Bernoulli trials, each with the same probability of success. It is a discrete probability distribution characterised by two parameters: n (number of trials) and p (probability of success on each trial). It is widely used in quality control, clinical trials, and survey analysis.
Key Formula
P(X = k) = C(n,k) × p^k × (1-p)^(n-k)
LaTeX: P(X = k) = \binom{n}{k} p^k (1-p)^{n-k}
| Symbol | Meaning | Unit |
|---|---|---|
| n | number of independent trials | unitless |
| k | number of successes | unitless |
| p | probability of success on a single trial | unitless |
| \binom{n}{k} | binomial coefficient (n choose k) | unitless |
Worked Example
Problem
A quality inspector checks 5 items from a batch where each item has a 20% defect rate. What is the probability that exactly 2 items are defective?
Solution
Step 1: Identify parameters: n = 5, k = 2, p = 0.20. Step 2: Calculate the binomial coefficient: C(5,2) = 5! / (2! × 3!) = 10. Step 3: Calculate p^k: (0.20)^2 = 0.04. Step 4: Calculate (1-p)^(n-k): (0.80)^3 = 0.512. Step 5: Multiply: P(X = 2) = 10 × 0.04 × 0.512 = 0.2048.
Answer
P(X = 2) = 0.2048, or about 20.5%
Properties of the Binomial Distribution (n = 10, p = 0.3)
| Property | Formula | Value (n=10, p=0.3) | Interpretation |
|---|---|---|---|
| Mean | μ = np | 3 | Expected number of successes |
| Variance | σ² = np(1−p) | 2.1 | Spread of outcomes |
| Std Deviation | σ = √(np(1−p)) | ≈ 1.449 | Typical deviation from mean |
| Mode | floor((n+1)p) | 3 | Most likely outcome |
| Skewness | (1−2p)/√(np(1−p)) | ≈ +0.276 | Slight right skew when p < 0.5 |
Interactive Tools
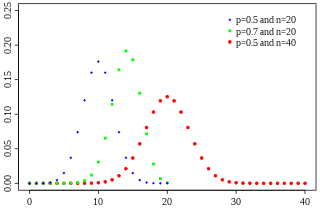
Wikimedia Commons, CC BY-SA
Related Terms
Probability Distribution
A probability distribution is a mathematical function that describes the likelihood of each possible outcome of a random variable. It assigns a probability to every possible value or range of values that the variable can take, with all probabilities summing to 1. Probability distributions are foundational in statistics and are used in fields ranging from insurance and finance to physics and machine learning.
Poisson Distribution
The Poisson distribution models the number of events occurring within a fixed interval of time or space, given that events happen independently at a constant average rate λ. It is a discrete distribution and is particularly useful when events are rare relative to the number of opportunities. Applications include modelling call-centre traffic, radioactive decay counts, and the number of defects per unit area.
Expected Value
The expected value (or expectation) of a random variable is the probability-weighted average of all possible values it can take. It represents the long-run average outcome if the experiment were repeated many times. Expected value is central to decision theory, gambling, insurance, and financial risk analysis.
From Latin bi- (two) and nomen (name), referring to the two-term expansion (success/failure). The distribution was studied by Jacob Bernoulli in Ars Conjectandi (1713) and named by Abraham de Moivre.