Hertzsprung-Russell Diagram
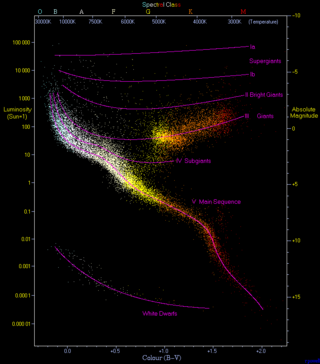
The Hertzsprung–Russell (H–R) diagram is a fundamental scatter plot in stellar astrophysics that plots stellar luminosity (or absolute magnitude) on the vertical axis against surface temperature (or spectral type/colour index) on the horizontal axis—with temperature increasing to the left—revealing that stars cluster into distinct evolutionary groups. The diagram was developed independently by Ejnar Hertzsprung (1905–1913) and Henry Norris Russell (1913) and remains the cornerstone tool for understanding stellar structure and evolution. The main sequence diagonal, the giant branch, the horizontal branch, the asymptotic giant branch, and the white dwarf region each represent different stages of stellar life and can be used to estimate stellar ages, distances, and populations in star clusters.
Major Regions of the Hertzsprung-Russell Diagram
| Region | Temperature Range (K) | Luminosity Range (L☉) | Evolutionary Stage | Example Stars |
|---|---|---|---|---|
| Upper Main Sequence | 10,000–50,000 | 10³–10⁶ | H-core burning (O/B stars) | Rigel, Spica |
| Lower Main Sequence | 2,400–7,000 | 10⁻⁴–1 | H-core burning (K/M stars) | Proxima Cen, Sun |
| Red Giant Branch | 3,500–5,000 | 10–10³ | H-shell burning | Aldebaran, Arcturus |
| Horizontal Branch | 5,000–10,000 | ~50 | He-core burning | RR Lyrae variables |
| Asymptotic Giant Branch | 3,000–4,000 | 10³–10⁴ | He/H-shell burning | Mira, IRC+10216 |
| White Dwarf Sequence | 5,000–80,000 | 10⁻⁴–10⁻² | Cooling remnant | Sirius B, Procyon B |
Interactive Tools
Wikimedia Commons, CC BY-SA
Related Terms
Main Sequence Star
A main sequence star is a star in the longest and most stable phase of its life, during which it fuses hydrogen into helium in its core to balance gravitational contraction through radiation pressure, a state called hydrostatic equilibrium. On the Hertzsprung–Russell diagram, main sequence stars form a diagonal band called the Zero Age Main Sequence (ZAMS) running from hot, luminous blue stars (upper left) to cool, dim red dwarfs (lower right). The Sun has been on the main sequence for approximately 4.6 billion years and will remain there for another ~5 billion years before evolving into a red giant.
Stellar Luminosity
Stellar luminosity is the total power output of a star—the total amount of electromagnetic energy radiated per unit time across all wavelengths—and is a fundamental intrinsic property independent of the observer's distance. Luminosity depends on both the star's surface temperature and its radius, as described by the Stefan–Boltzmann law: more luminous stars are either larger, hotter, or both. The Sun's luminosity (L☉ = 3.828×10²⁶ W) serves as the standard unit, and stellar luminosities range from ~10⁻⁴ L☉ for the faintest red dwarfs to over 10⁶ L☉ for the most massive O-type supergiants.
Red Giant
A red giant is a luminous, greatly expanded star in a late stage of stellar evolution that has exhausted the hydrogen fuel in its core; the core contracts and heats up while the outer layers expand dramatically, cooling and reddening to surface temperatures of 3,500–5,000 K. For Sun-like stars (0.5–8 M☉), the red giant phase follows departure from the main sequence when hydrogen shell burning drives the envelope to expand up to 200 times the star's original radius. Red giants eventually shed their outer layers to form planetary nebulae, leaving behind a white dwarf, while more massive stars may become red supergiants and ultimately explode as supernovae.
Named after Danish astronomer Ejnar Hertzsprung (1873–1967) and American astronomer Henry Norris Russell (1877–1957), who independently discovered the luminosity–temperature relationship for stars in the early 20th century. The hyphenated name reflects equal credit for their parallel discoveries; the diagram was popularised after Russell presented it at the Royal Astronomical Society in 1913.