Law of Large Numbers
The Law of Large Numbers (LLN) states that as the number of independent, identically distributed trials of a random experiment increases, the sample mean converges to the true population mean (expected value). There are two forms: the Weak LLN (convergence in probability, proved by Jacob Bernoulli) and the Strong LLN (almost sure convergence, proved by Émile Borel). The LLN is the mathematical justification for empirical estimation of probabilities and the stability of statistical averages in the long run.
Key Formula
X̄ₙ → μ (in probability) as n → ∞
LaTeX: \bar{X}_n \xrightarrow{P} \mu \quad \text{as } n \to \infty
| Symbol | Meaning | Unit |
|---|---|---|
| \bar{X}_n | Sample mean of n observations | same as population |
| \mu | True population mean (expected value) | same as population |
| n | Number of observations | count |
| \xrightarrow{P} | Convergence in probability | N/A |
Worked Example
Problem
A fair coin (P(H) = 0.5) is tossed repeatedly. Demonstrate how the proportion of heads converges to 0.5 as n increases.
Solution
Step 1: After 10 tosses: e.g., 4 heads → proportion = 0.40 (error = 0.10). Step 2: After 100 tosses: e.g., 47 heads → proportion = 0.47 (error = 0.03). Step 3: After 1 000 tosses: e.g., 503 heads → proportion = 0.503 (error = 0.003). Step 4: After 10 000 tosses: e.g., 4 996 heads → proportion = 0.4996 (error = 0.0004). Step 5: By LLN, the proportion converges to μ = E[X] = 0.5.
Answer
As n → ∞, the observed proportion of heads converges to the true probability 0.5
Weak vs Strong Law of Large Numbers
| Feature | Weak LLN | Strong LLN |
|---|---|---|
| Convergence type | In probability | Almost sure (a.s.) |
| Formal statement | P(|X̄ₙ − μ| > ε) → 0 for all ε > 0 | P(lim X̄ₙ = μ) = 1 |
| Proved by | Jacob Bernoulli (1713) | Émile Borel (1909) |
| Condition | Finite variance (Chebyshev) | Finite mean (Kolmogorov) |
| Practical meaning | Deviations become unlikely | Deviations eventually stop |
| Application | Monte Carlo methods | Theoretical guarantees |
Interactive Tools
GeoGebra — LLN Simulation
Simulate repeated coin flips and dice rolls to observe LLN convergence visually
Open ToolKhan Academy — Law of Large Numbers
Video introduction to the Law of Large Numbers and expected value
Open ToolBrilliant.org — Probability
Interactive probability course covering the LLN and convergence theorems
Open Tool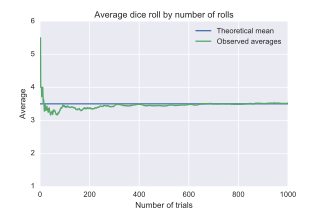
Wikimedia Commons, CC BY-SA
Related Terms
Central Limit Theorem
The Central Limit Theorem (CLT) states that the sampling distribution of the sample mean approaches a normal distribution as the sample size n increases, regardless of the shape of the underlying population distribution, provided the population has a finite mean and variance. For most practical purposes, normality is achieved when n ≥ 30. The CLT is the theoretical foundation for Z-tests, t-tests, confidence intervals, and virtually all classical inferential statistics.
Hypothesis Testing
Hypothesis testing is a formal statistical procedure for making decisions about a population parameter based on sample data, by evaluating evidence against a null hypothesis (H₀) in favour of an alternative hypothesis (H₁). A test statistic is computed and compared to a critical value or converted to a p-value; if the result is statistically significant (p < α), the null hypothesis is rejected. It underpins scientific research, clinical trials, quality assurance, and data-driven decision-making across all quantitative disciplines.
Z-score
A Z-score (also called a standard score) measures how many standard deviations a data point is from the mean of its distribution. It standardises values from different distributions, enabling direct comparison by placing them on a common scale. Z-scores are widely used in quality control, hypothesis testing, and the construction of standard normal tables.
Jacob Bernoulli proved the first form of this theorem around 1689, publishing it posthumously in "Ars Conjectandi" (1713). The name "Law of Large Numbers" was first used by Siméon Denis Poisson in 1837, from the intuitive idea that large samples reliably reflect true probabilities.