Phase Diagram
A phase diagram is a graphical representation showing the equilibrium states of matter (solid, liquid, gas, and sometimes plasma or supercritical fluid) for a given substance as a function of temperature and pressure. The diagram delineates phase boundaries (lines along which two phases coexist), the triple point (where all three phases coexist), and the critical point (beyond which liquid and gas phases become indistinguishable). Phase diagrams are essential tools in materials science, chemical engineering, and geochemistry for predicting phase behavior under varying conditions.
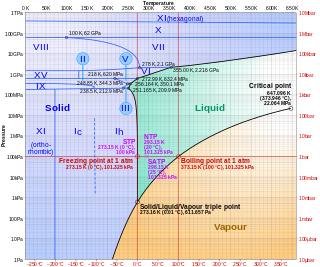
Key Features of a Typical Phase Diagram (Water)
| Feature | Location | Conditions | Significance |
|---|---|---|---|
| Melting curve | Solid–liquid boundary | Negative slope for H₂O | Pressure lowers melting point |
| Vaporization curve | Liquid–gas boundary | Ends at critical point | Boiling point vs pressure |
| Sublimation curve | Solid–gas boundary | Below triple point | Solid converts to gas directly |
| Triple point | Junction of 3 curves | 273.16 K, 611.7 Pa | All three phases coexist |
| Critical point | End of vaporization curve | 647 K, 22.1 MPa | Supercritical fluid forms |
| Supercritical region | Above critical point | High T and P | Fluid with gas and liquid properties |
Interactive Tools
Wikimedia Commons, CC BY-SA
Related Terms
Triple Point
The triple point of a substance is the unique combination of temperature and pressure at which all three phases — solid, liquid, and gas — coexist in thermodynamic equilibrium simultaneously. For water, the triple point is precisely 273.16 K (0.01 °C) and 611.73 Pa, a value so reproducible that it historically served as the definition of the kelvin in the International System of Units. The triple point is an invariant point: changing temperature or pressure in any direction will shift the system away from three-phase coexistence.
Critical Point
The critical point is the endpoint of the liquid–gas phase boundary on a phase diagram, defined by the critical temperature (T_c) and critical pressure (P_c), beyond which the distinction between liquid and gas phases disappears and the substance exists as a supercritical fluid. Above the critical temperature, no amount of pressure can liquefy the gas; above the critical pressure at the critical temperature, the fluid exhibits properties intermediate between gas and liquid. Supercritical fluids have important industrial applications, such as supercritical CO₂ in extraction processes.
Vapor Pressure
Vapor pressure is the pressure exerted by the vapor of a substance in equilibrium with its liquid (or solid) phase at a given temperature in a closed system. It is a measure of the tendency of molecules to escape from the liquid phase into the gas phase, and increases exponentially with temperature according to the Clausius–Clapeyron equation. Vapor pressure determines a liquid's boiling point (the temperature at which vapor pressure equals atmospheric pressure), and is critical in understanding evaporation, distillation, and humidity.
From Greek 'phasis' (appearance) and Latin 'diagramma' (outline). Phase diagrams were developed systematically in the late 19th century, with contributions by Josiah Willard Gibbs (Gibbs phase rule, 1876) and Bakhuis Roozeboom.